Accepted to IEEE SciVis 2020. To appear in IEEE Transactions on Visualization and Computer Graphics
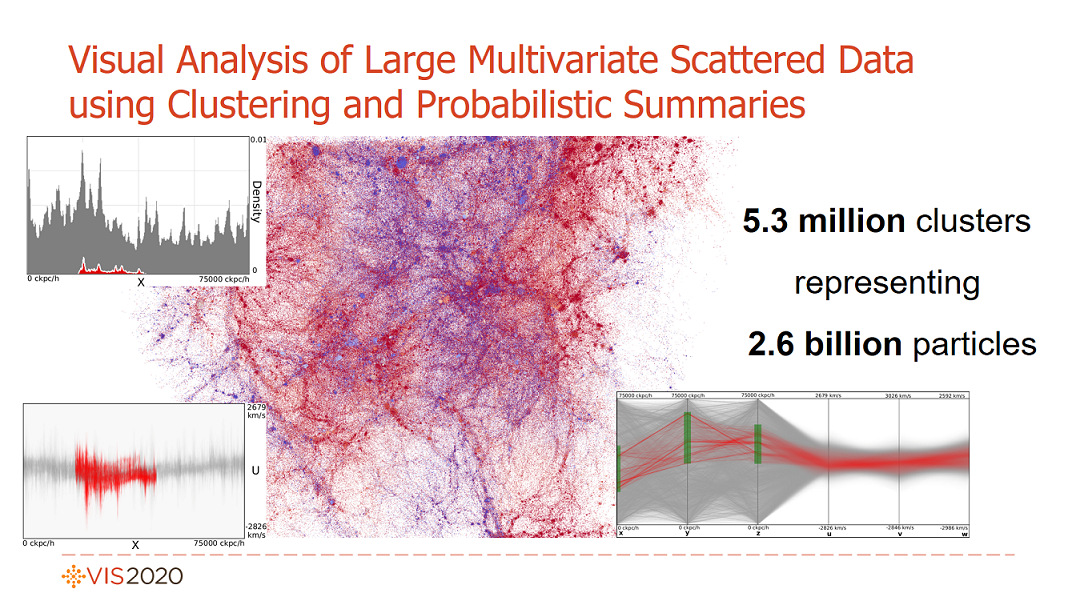
Our probabilistic summary of a cosmological dataset represents 2.6 billion particles partitioned into 5.3 million clusters.
We model each cluster using combinations of low-dimensional Gaussian mixture models.
This allows us to interactively visualize the position of particles by splatting 3D Gaussians and to create density-based 1D and 2D plots and a parallel coordinate plot.
All of those views support interactive navigation and exploration by brushing (red) and linking.
We render this massive dataset in 28 ms on an NVIDIA GTX 1080 Ti at a resolution of 1920x1080.
Abstract
Rapidly growing data sizes of scientific simulations pose significant challenges for interactive visualization and analysis techniques.
In this work, we propose a compact probabilistic representation to interactively visualize large scattered datasets.
In contrast to previous approaches that represent blocks of volumetric data using probability distributions, we model clusters of arbitrarily structured multivariate data.
In detail, we discuss how to efficiently represent and store a high-dimensional distribution for each cluster.
We observe that it suffices to consider low-dimensional marginal distributions for two or three data dimensions at a time to employ common visual analysis techniques.
Based on this observation, we represent high-dimensional distributions by combinations of low-dimensional Gaussian mixture models.
We discuss the application of common interactive visual analysis techniques to this representation.
In particular, we investigate several frequency-based views, such as density plots in 1D and 2D, density-based parallel coordinates, and a time histogram.
We visualize the uncertainty introduced by the representation, discuss a level-of-detail mechanism, and explicitly visualize outliers.
Furthermore, we propose a spatial visualization by splatting anisotropic 3D Gaussians for which we derive a closed-form solution.
Lastly, we describe the application of brushing and linking to this clustered representation.
Our evaluation on several large, real-world datasets demonstrates the scaling of our approach.
Notes
This work will be presented at IEEE VIS 2020.
Downloads